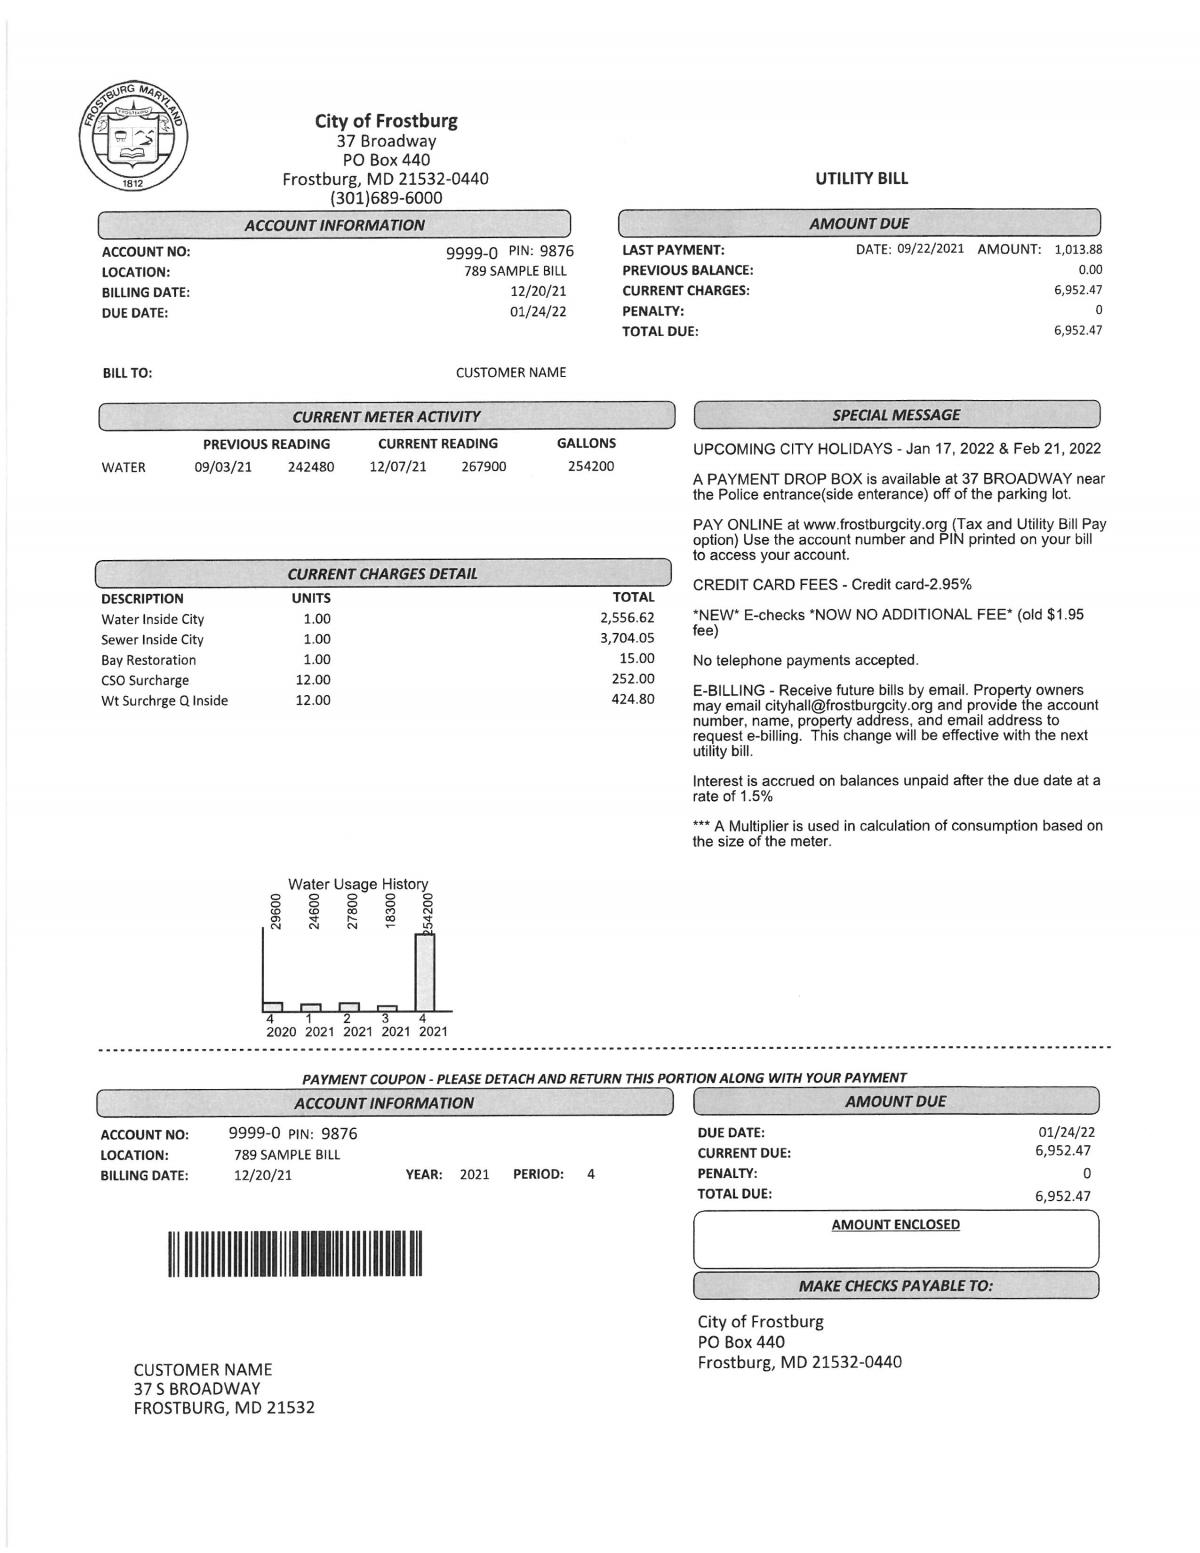
Example of Multi-Unit and Consumption Over 50,000 Gallons

Only information that is different from the single unit residential bill is shown here. This example shows what a bill may look like if a property has multiple units or is billed for consumption exceeding 50,000 gallons of usage.
Current Charges Detail:
The billed water and sewer charges will vary based on the water meter reading.
- Water Inside City: For the sample bill the rate is $5.80 per 1,000 gallons and $11.10 for over 50,000 gallons. We need to subtract the first 50,000 gallons from the total usage (254,200 - 50,000 =204,200).
50,000 / 1,000 x $5.80 = $290.00
204,200 / 1,000 x $11.10 = $2,266.62
Total water billed: $2,556.62
- Sewer Inside City: The billed sewer charge is based on the metered water consumption, however sewer is billed at a higher rate per 1,000 gallons compared to water. The calculation of the sewer charge for the example bill is as follows:
50,000 / 1,000 x $11.80 = $590.00
204,200 / 1,000 x $15.25 = $3,114.05
Total sewer billed: $3,704.05
- Bay Restoration, Water Surcharge, and CSO Surcharge are recalculated yearly in February to re-evaluate units billed for commercial and multi-unit accounts.
- This property is exempt from the Garbage fee because it is more than 4 units AND they have a dumpster onsite for tenants to use.
- Bay Restoration is only 1 unit since the yearly usage is rated for 1 EDU (Equivalent Dwelling Unit) per the State of Maryland. The State of Maryland considers 1 EDU to be 91,250 gallons in the year.
- CSO Surcharge (combined sewer overflow) is based on the number of units available or the yearly usage divided by 38,000 gallons of sewer, whichever is higher.
- Wt Surcharge Q (water surcharge quarterly) is based on the number of units available or the yearly usage divided by 38,000 gallons of water, whichever is higher.
- CSO and Water Surcharge are based on FDE (Frostburg Dwelling Equivalent) which is based on 38,000 gallons per year. See City Code Section 6-13 for complete details.
- Usage Bar Graph shows the prior four usage cycles and the current cycle. Looking at the sample, 2021 period 4 the usage is 18 times higher than prior quarter. A spike this high is often a serious leak. In this example, the issue causing the increased consumption was a leaking toilet in one of the units.
